Observed Precipitation - SENAMHI
Information on the precipitation observed at the automatic SENAMHI stations is available here.
In menu>variable you can select the variable: measured and percentage. In menu>region you can select a region.
Observed: This map shows the precipitation, derived from the PISCO rainfall product from SENAMHI. The measurements are in [mm/month].
Percentage: This map shows the precipitation as percentage of the precipitation normally expected in this month. The percentage indicates conditions of deficit to the normal situation.
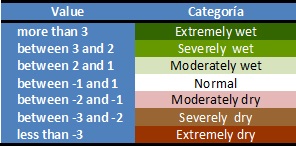
Standardized Anomaly: This map shows the precipitation as standardized anomaly. The anomaly is the difference between the precipitation measured and the precipitation normally expected in this month. The anomaly indicates conditions of deficit or surplus of precipitation compared to a normal situation (Table 1).
Tabel 1: Interpretation of the Standardized Anomalies
Data Source
The data used for the precipitation maps are derived from meterological stations monitored by the Servicio Nacional de Meterología e Hidrología del Perú (SENAMHI) and the PISCO database ('Peruvian Interpolation of the SENAMHIs Climatological and Hydrological Stations').
NOTE: The PISCO database is validated until December 2013, while values after this date are preliminary values that will be validated later on.
References
Waldo Lavado Casimiro, Carlos Fernandez, Fiorella Vega, Tania Caycho, Sofia Endara, Adrian Huerta y Oscar Felipe Obando, 2015. PISCO: Peruvian Interpolated data of the SENAMHIs Climatological and hydrological Observations. Precipitación v1.0. Servicio Nacional de Meteorología e Hidrología.
Waldo Lavado Casimiro, Carlos Fernandez, Cesar Aybar, Tania Caycho, Sofia Endara, Fiorella Vega, Adrian Huerta, Julia Acuña y Oscar Felipe Obando, 2016. PISCO: Peruvian Interpolated data of the SENAMHIs Climatological and hydrological Observations. Precipitation v1.1 Servicio Nacional de Meteorología e Hidrología.
![]()
How is the percentage calculated?
The percentage is calculated by deviding the monthly precipitation measured in a station by the average precipitation (calculated using historical data of the specific station and month in consideration) and multiplying it with 100.
How is the anomaly calculated?
The anomaly is the monthly precipitation measured in a station minus the average precipitation (calculated using historical data of the specific station and month in consideration) devided by the standard deviation.
Data Source
observed Precipitation in stations, provided by SENAMHI (SENAMHI)
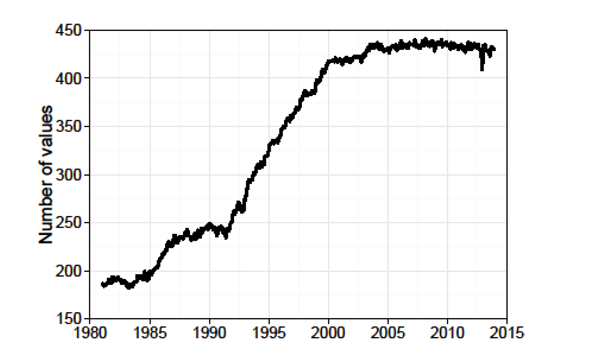
A variale number of stations (between 180 and 448) during th e period 1981 until 2013 is used to derive the PISCO product. Data beyond that date are still subject to later validation.
The figure shows the number of stations used each year.
References
Waldo Lavado Casimiro, Carlos Fernandez, Fiorella Vega, Tania Caycho, Sofia Endara, Adrian Huerta y Oscar Felipe Obando, 2015. PISCO: Peruvian Interpolated data of the SENAMHIs Climatological and hydrological Observations. Precipitación v1.0. Servicio Nacional de Meteorología e Hidrología.
Waldo Lavado Casimiro, Carlos Fernandez, Cesar Aybar, Tania Caycho, Sofia Endara, Fiorella Vega, Adrian Huerta, Julia Acuña y Oscar Felipe Obando, 2016. PISCO: Peruvian Interpolated data of the SENAMHIs Climatological and hydrological Observations. Precipitation v1.1 Servicio Nacional de Meteorología e Hidrología.
![]()
Helpdesk
Contact mwar_lac@unesco.org with any technical questions or problems with this Map Room.