Historical Probability of Seasonal Gridded Precipitation Tercile Conditioned on ENSO
These maps display the frequency with which 3-month seasonal precipitation totals were observed to be within the upper (wet) one-third, middle (normal) one-third, or bottom (dry) one-third (Tercile) of the historical (1950-2002) distribution given the state of ENSO (El Niño (nino), La Niña (nina)) during that same season.
For this analysis, El Niño and La Niña events are defined based upon the NINO3.4 SST anomaly index (averaged SST anomaly over the region 5°S to 5°N; 170°W-120°W). Both the precipitation amounts and the NINO3.4 index are defined for 3-month averaged seasons, and for 12 overlapping seasons in the year. The maps show the proportions of years that experienced above-, near-, and below-normal precipitation. As an example, a data point with a value of 0.6 for above-normal precipitation, 0.3 for near-normal precipitation, and 0.1 for below-normal precipitation in a particular season would indicate that for the years in which NINO3.4 reached its warmest values during 1950-2002, 6 out of 10 of those years experienced above-normal precipitation over that grid point in that season, 3 out of 10 experienced near-normal precipitation, and 1 out of 10 experienced below-normal precipitation.
Data Source
The precipitation data used for the maps are derived from meterological stations monitored by the Servicio Nacional de Meterología e Hidrología del Perú (SENAMHI) and the PISCO database ('Peruvian Interpolation of the SENAMHIs Climatological and Hydrological Stations').
NOTE: The PISCO database is validated until December 2013, while values after this date are preliminary values that will be validated later on.
![]()
References
Mason, S.J. and L. Goddard, 2001: Probabilistic precipitation anomalies associated with ENSO. Bull. Amer. Meteor. Soc., 82, 619-638. doi: http://dx.doi.org/10.1175/1520-0477(2001)082<0619:PPAAWE?2.3.CO;2
Waldo Lavado Casimiro, Carlos Fernandez, Fiorella Vega, Tania Caycho, Sofia Endara, Adrian Huerta y Oscar Felipe Obando, 2015. PISCO: Peruvian Interpolated data of the SENAMHIs Climatological and hydrological Observations. Precipitación v1.0. Servicio Nacional de Meteorología e Hidrología.
Dataset Documentation
Precipitation Data
Data Source
Observed precipitation in stations, provided by SENAMHI (SENAMHI)
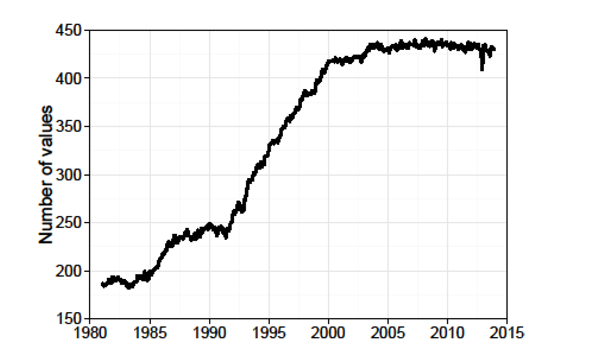
A variable number of stations (between 180 and 448) during the period 1981 until 2013 is used to derive the PISCO product. Data beyond that date are still subject to later validation.
The figure shows the number of stations used each year.
Reference
Waldo Lavado Casimiro, Carlos Fernandez, Fiorella Vega, Tania Caycho, Sofia Endara, Adrian Huerta y Oscar Felipe Obando, 2015. PISCO: Peruvian Interpolated data of the SENAMHIs Climatological and hydrological Observations. Precipitación v1.0. Servicio Nacional de Meteorología e Hidrología.
![]()
Sea Surface Temperature Data
- Data
- NINO3.4 SST monthly anomaly index (averaged SST monthly anomaly over the region 5°S to 5°N; 170°W-120°W) for 1950-2002
- Data Source
- Kaplan Extended reconstructed monthly sea surface temperature anomaly dataset (Data Library entry)
- Reference
- Kaplan, A., M. Cane, Y. Kushnir, A. Clement, M. Blumenthal, and B. Rajagopalan, 1998: Analyses of global sea surface temperature 1856-1991. Journal of Geophysical Research. 103, 18,567-18,589. DOI: 10.1029/97JC01736
Helpdesk
Contact help@iri.columbia.edu with any technical questions or problems with this Map Room.