Normalized Difference Vegetation Index
This map shows the actual situation of the vegetation as reflected by the Normalized Difference Vegetation Index (NDVI).
The NDVI uses information of reflectance of two spectral regions: visible light region and near infrared region. The condition of the vegetation influences the interaction between these two spectral regions and the vegetation. This way the NDVI can be related to the condition of the vegetation. The NDVI has a value between -1 and +1.
It is possible to visualize the NDVI as observed or as its anomaly. Select a variable in menu>variable.
Observed: The observed NDVI has a value between -1 and +1 and is available on a monthly basis. The closer the NDVI to +1, the better the conditions of the vegetation. For example, a forest will have a NDVI closer to +1 opposed to a dessert area that will have a NDVI value closer to 0.
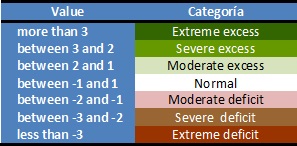
Anomaly: The NDVI expressed as anomaly indicates the deviation from the NDVI compared to the average. Positive values indicate that the NDVI is greater than the NDVI expected normally. Negative values indicate that the observed NDVI is smaller than the NDVI expected normally (Table 1).
Tabel 1: Interpretation of the Standardized Anomalies
The data used to calculate the NDVI are measured by the satellite sensor MODIS "Moderate Resolution Imaging Spectroradiometer".
It is possible to create local graphs of the NDVI, select the tab "Instructions" for more information.
How is the NDVI calculated?
The NDVI is calculated as:
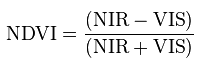
Where VIS is the spectral reflectance in the visible region (red) expressed as ratio (reflectance/incoming) and NIR is the reflectance in the near infrared region (reflectance/incoming).
The figure below illustrates the calculation of the NDVI:
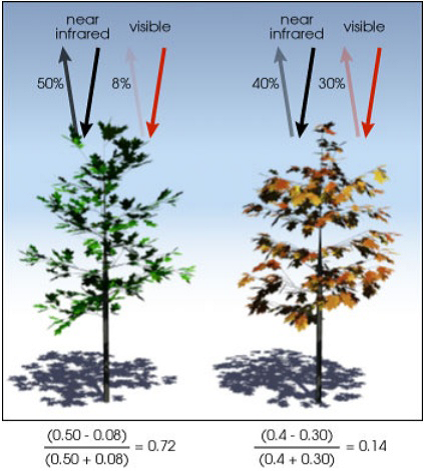
Figure 1: Example of NDVI calculation
What is the interaction between the vegetation and the spectral regions NIR and VIS?
Plants absorb and reflect particular regions of the light spectrum. Large part of the VIS is absorbed by plants and used in the photosynthesis process. Large part of the NIR is reflected by plants because it cannot be used in the photosynthetic process. When plants are in bad condition there is a change in the absorbance and reflectance of VIS and NIR.
Dataset Documentation
- Data
- 1 month estimates on a 1km lat/lon grid dataset
- Data Source
- United States Geological Survey, Land Processes Distributed Active Archive Center, Moderate Resolution Imaging Spectroradiometer USGS LandDAAC MODIS Note:There is typically a 12- to 16-day delay between the end of the observation period for the latest data and the date when those data are received and displayed on this page.
Helpdesks
Contact mwar_lac@unesco.org with any technical questions or problems with this Map Room, for example, the forecasts not displaying or updating properly.
Instructions
The MODIS interface provides users with the ability to make graphs. The interface provides a contextual perspective of recent MODIS images by displaying an interactive map of the Normalized Difference Vegetation Index (NDVI). Time series analyses of NDVI are generated based on user-selected parameters.
Isolating a certain region of interest can be accomplished by clicking and dragging a rectangle across that region. The map will zoom to that area to allow for more precise variable. Any zoom level will allow for the user to click a location and generate 2 separate time series. Changing the area over which the spatial averaging is performed will modify the resolution of variable estimation.
Time series a: monthly estimates of NDVI for the selected region selected for the last 12 months.
Time series b: The monthly estimates of NDVI for the current and five most recent years are plotted for comparison. The thick black line is the same series shown in a.