Standardized Precipitation Index
This map can be used to identify the intensity of drought or excess of rainfall for each month. It shows the Standardized Precipitation Index (SPI).
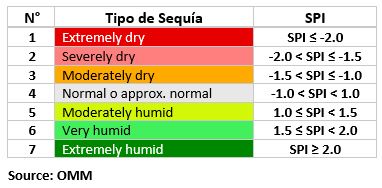
SPI values more negative than -1 indicate a condition of drought, the more negative the value the more severe the situation. SPI values higher than +1 indicate more humid conditions compared to a normal situation. When the SPI has a value between -1 and +1 the situation is identified as normal. The table below can be used to interpret the SPI value.
Table: Normalized Index Values of Precipitation
Colors more close to red in the map indicate a dry condition, colors more close to green indicate a humid condition compared to the normal condition that specific area.
The SPI is available for different accumulation periods: 1, 3, 6, 9 and 12 months. This allows evaluating the duration of drought or humid condition at different time scales. You can select the time scale in the menu>analysis.
How is the SPI calculated?
The Standardized Precipitation Index (SPI; McKee 1993) is the number of standard deviations that observed cumulative precipitation deviates from the climatologically average. It can be calculated for any time scale. Here the SPI is available for 1, 3, 6, 9 or 12 months.
To compute the index, a long-term time series of precipitation accumulations over the desired time scale are used to estimate an appropriate probability density function. The analyses shown here are based on the Pearson Type III distribution (i.e., 3-parameter gamma) as suggested by Guttman (1999). The associated cumulative probability distribution is then estimated and subsequently transformed to a normal distribution. The result is the SPI, which can be interpreted as a probability using the standard normal distribution (i.e., users can expect the SPI to be within one standard deviation of the mean about 68% of the time, two standard deviations about 95% of the time, etc.) The analyses shown here utilize the FORTRAN code made available by Guttman (1999).
References
Guttman, N. B., 1999: Accepting the Standardized Precipitation Index: A calculation
algorithm. J. Amer. Water Resour. Assoc.., 35(2), 311-322.
McKee, T. B., N. J. Doesken, and J. Kliest, 1993: The relationship of drought frequency
and duration to time scales. In Proceedings of the 8th Conference of Applied Climatology, 17-22 January, Anaheim,
CA. American Meteorological Society, Boston, MA. 179-184.
Dataset Documentation
- Data
- CPC Unified Precipitation with a spatial resolution of 0.5° lat/lon data
- Data Source
- NOAA NCEP Climate Prediction Center, CPC Unified Precipitation
Helpdesk
Contact mwar-lac@unesco.org with any technical questions or problems with this Map Room.